First things first, in order to demonstrate that I bring alpha, here is the YTD performance of my portfolio vs leading indices:
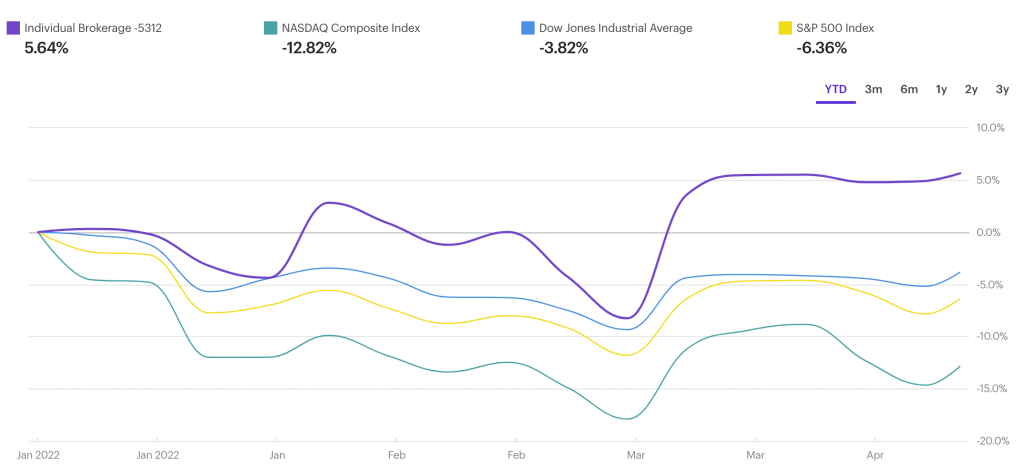
Me: 5.64%, nasdaq: -12.82, so ~17% of alpha vs the nasdaq, which is the relevant benchmark to compare to, till now. And from the graph its easy to see a couple of things. I’m not shorting the market such that when the market goes down I go up (and the other way around), as theres quite a bit of correlation between the indices and my portfolio. Rather my portfolio generally goes down less than the index, and then when the index goes up mine goes up a bit more sharply.
So on to the interesting part. What do I hold?
Here is a screenshot of my real money, live portfolio, as of today (right click and open image in new tab to be able to zoom in), which I will immediately explain:

The portfolio is divided into a couple different strategies: short puts, asymetical butterfly spreads, and hedges. And I’ll go over the portfolio assuming the reader knows options, because they are all option positions. In a later post I will do more in depth, beginner explanations, this post is really just to get the portfolio (and this blog) out there, hopefully getting people to think.
At my most basic are short puts, super far out in time (1-2 years), at a strike 30-50% below the money. To anyone this is gibberish to, first of all look it up on google, second of all comment and I’ll be happy to put a more basic, detailed post about it if I see people want me to. But let me explain whats powerful about these positions, and why I chose this specific combination of strike and timeframe.
I don’t have a lot of faith the market can sustain its current valuations. Nonetheless, I have felt this way for the past 5 years, and honestly have been badly wrong the vast majority of the time. So at the same time, I want to participate in this market and not sit it out. By selling the puts, I’m promising to buy the stock for the given strike, and history shows that over most periods of 2 years, the market is equally high or higher than it was 2 years ago. And its easy to see this if you look at a graph of say the nasdaq:
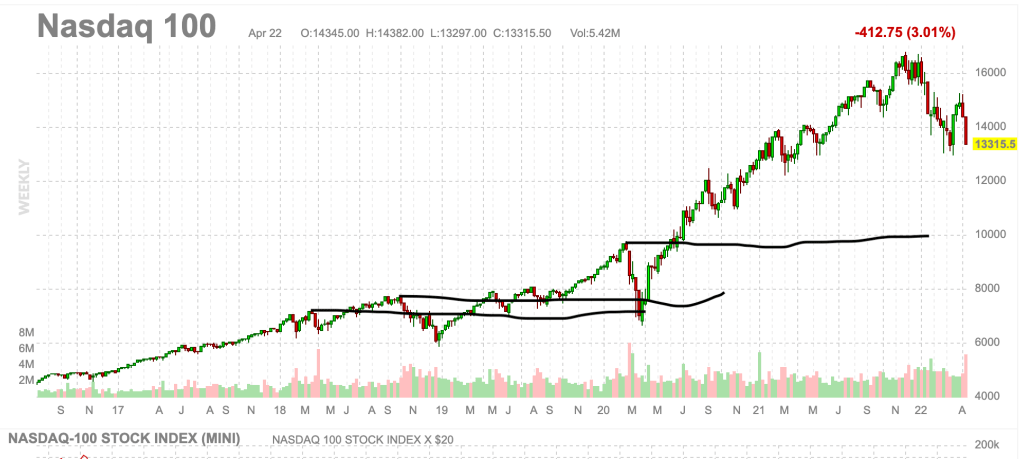
I marked the peaks, and its easy to see that 2 years later the index was higher (or basically even on the first marking, but promptly higher).
But ok, thats only the last 5 years, and the market has been great during that time. Ok, lets zoom out:
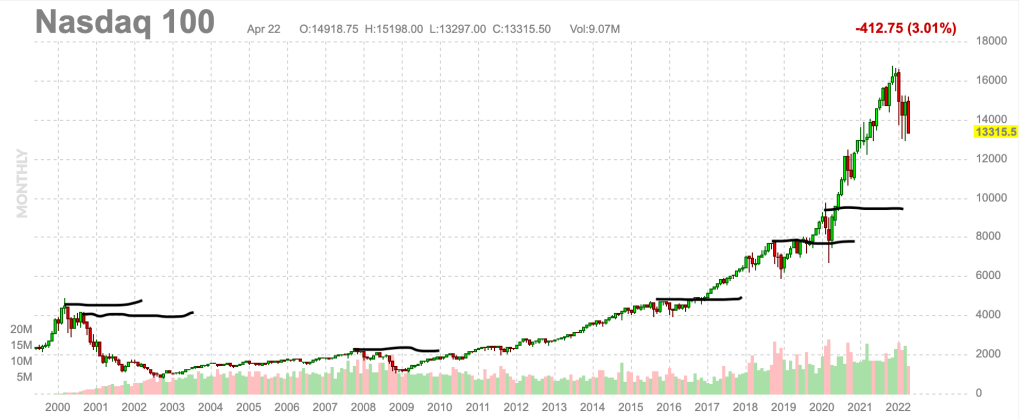
This graph includes the major crashes of 2000 and 2008. So it actually took like 14 years to recover from the dotcom bust of 2000, and I’ll address that in a second. But other than the crash of 2000, literally any point you chose on the graph, 2 years later the index is basically as high or higher than it was. This is the reason I chose the 2 year time frame on the short puts. And in order to give me some added buffer, I sell puts 30-50% below current underlying price. This combination makes it so that probability is HIGHLY (!!!) on my side for the puts to expire worthless, in fact in all cases other than a correction the size of the dot com bubble, most of the puts will expire worthless (as these are puts on specific companies not on an index).
Regarding the dot com bust: in my first post I referred to buying and forgetting for 20 years, and in that time frame its basically guaranteed you will have made money. This holds as well if you invested at the top of the 2000 bubble and held for 20 years. In fact, if you did that, after 20 years you would have ~100% gain over that time, so doubled your money over 20 years. If instead of buying at the peak of 2000 you got lucky and buyght at the beginning of 2003, after 20 years you would have ~1300% gains (and counting because 20 years arent up yet since 2003), so not a 10 bagger, but better! 13x! And thats the reason dollar cost averaging is so important. Because its impossible to know not to invest in 2000, and its impossible to know to go all in in 2003. So its best to average in, and then you will still make somewhere between the minimum 100% and the maximum 1300% over the 20 years.
So back to my portfolio.
If we are right now at the equivalent of the top of the 2000 dot com bubble, my portfolio and the nasdaq are both set to lose a lot of value. The likelyhood of a 75% drawdown over the next 3 years is quite unlikely (although obviously possible – its happened before). So I set up my portfolio to make minimum viable returns (5-10% a year) just based on the short put premium, and leave plenty (!) of cash on the side which I will be able to deploy should a correction (or a crash style 2000) come along.
So lets talk about the positions, because this is getting a bit long (and I encourage you to open the screenshot on a new tab so you can jump across and see the positions I’m talking about).
Short apple puts: I have 3 short contracts in total at $100-105 strikes, 2-2.5 years out. Apple is currently ~170$, so $100 would be a ~40% drawdown in share price. Even in the covid madness of march 2020 apple only went down from 80 -> $60 so 25%. Needless to say, AAPL at 100$ would be a great buying oppotunity, and if someone is willing to pay me 1600$ to promise to buy apple for 100$ any time in the next 2 years… SHUT UP AND GIVE ME YOUR MONEY!!!
The same thing goes for ADBE, AMZN, FB, FDX, etc etc… basically all the companies I sold short puts on for 30-50% below their current strike… They are companies I would love to buy for those prices, if they ever were to get there. GOOG, HD, TSLA – these are all companies that aren’t going to disappear. So if there is a 30-50% drawdown on any of these companies I would see it as a buying opportunity, and I can’t understand anyone who wouldn’t. If you wouldn’t I sure as hell hope you aren’t buying anything currently! Which means you’re either shorting (which historically isn’y successful over the long run), or you’re sitting out of the market, which also isn’t successful historically, especially in the current inflationary environment, you’re just letting your net worth devalue itself at a rate of 3-10% annually (depending on who you ask and who you believe).
So the 30-50% OTM thing is my way of dollar cost averaging in, although its more effective, because in the next 2 years, no matter if the market goes up down or sideways, as long as it doesn’t go >30% down, I’ll make my short put premium. Whereas if I bought an index with 10% of my net worth, if the market went down 10% over each of the next 2 years, assuming I added another 10% after the first year, I would still lose ~3% of my net worth. So although the 2 year OTM short put positions don’t pay off very highly, its a good way of passing time in the market waiting for a proper entrypoint. And this I think is the challenge most begining investors have – when/how do I enter? What if the market tanks just after I get in? And it almost always feels like it will. But I have friends who have been waiting for a 50% correction for the past 5 years, with 100-250k$ just waiting to get in, and meanwhile have missed out on a 100-200% index gain over that time.
Other than the short put positions, there are modified butterfly spreads (generally with the upper spread 1/2 of the lower spread, such that if the underlying flies up past the upper leg I still make the value of the difference between the spreads minus the cost of the position).
So for example the AMZN calls: I have a 1×3100-2×3150-1×3175 call “buttefly”. So its a 50$ lower spread and 25$ upper spread, which cost me ~1300$. So worst case is AMZN below 3100 in which case I lose the initial cost, best case is amzn at 3150 on expiration in which case I make 5k$ – 1300 initial cost so 3700$, or if AMZN goes above 3175 on expiration, I make 2500-1300 inital cost so I make 1200$. So its basically a coin flip position, with a tiny chance to make more than 100%. So the modified butterfly positions could work when a stock may have gone down significantly and the VIX is up, then the hope is in the next month the stock could bounce back up, and then I would pocket some change just for playing.
And then the last position is a hedge, its a position on the VIX. Its basically long VIX (volatility), which in general has a low probability of success, but I will play the VIX when it gets low, and this is relatively high leverage play, so if the vix pops any time in the next month I’ll lose a bunch of money on my other positions, but will be able to pocket a bit on the VIX jump, take profits on it, and eventually VIX will calm down and my other positions will go back up, but I’m a bit of change better off because of the VIX hedge.
Other than that I hold inconsquential positions in GBTC and ICCM which either you know them or you don’t, as of now they won’t have a significant effect on my portfolio performance.
So thats an initial overview of the positions as of now… The positions can change sometimes frequently sometimes not, it all depends what the market does, but I will update this blog (frequently) both with porfolio updates/adjustments but also with other thoughts that spring to mind as time goes by.

2 responses to “Initial portfolio overview”
[…] year for investors my portfolio is beating the indices by 9-17% (depending which index you choose), here is the post with my initial portfolio review which shows a graph of my portfolio performance […]
LikeLike
[…] this post, I show my full portfolio, which is made up of several short put positions, and a couple of […]
LikeLike